Remote debugging your Sitecore instance running on Azure Web Apps
If you're working on a Sitecore project that is hosted in Azure PaaS, surely you have found yourself in situations where there is a bug in production or UAT that you cannot easily reproduce in your local environment. Adding logging can also help in such situation, but sometimes this is not enough to troubleshoot your issue. So, debugging your Azure webapp instance seems to be the best and quick option to go and fix your bug!
First step, connect to Cloud Explorer
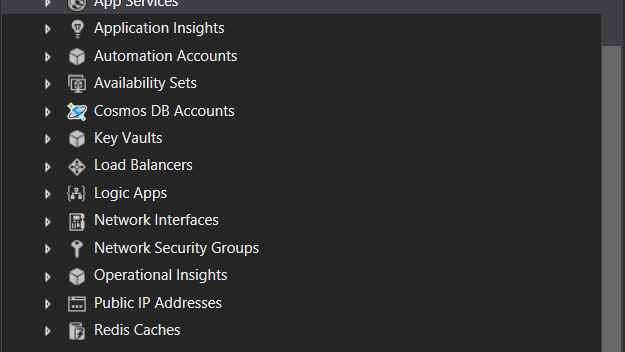
In Visual Studio, go to "main menu" -> "view" -> "Cloud Explorer". You'll get a list of resources that you have access within your Azure subscription. Search for the "App Services" section and choose the webApp you want to attach the debugger to. Note: choose the group by "Resource Types" option to make it easier to navigate.

You'll get there the list of different resources types, this time expand the "App Services" as this is where your Sitecore webApp should show up.
Before debugging
In order to be able to debug our code, of course we need our dll to be compiled in "debug" mode. So, as the deployed instance must be compiled in "release" mode so you have to first override the dll you want to attach the debugger to.
Make sure you're doing it with the same code base version that is deployed into the server you're going to test.

We'll also need to have the debugging symbols (*.pdb file) in place, so basically if you are debugging a feature called "MyProject.Feature.Navigation", then make sure you move those files to your webApp ("/bin" folder):
- MyProject.Feature.Navigation.dll (debug)
- MyProject.Feature.Navigation.pdb
Note: you can use the same Cloud Explorer to copy those files to the server!

Web App settings
In order to make it working, make sure that the remote debugging is enabled on your web app.
Go to the configuration sections and then "General Settings":

It's very simple, just enable it and choose the VS version you'll be using for debugging.
Let's debug!
So, as you can see the process is easy and very straightforward, there are several other ways for remote debugging a webApp, but the one I'm explaining here is the easiest one.
Your setup is already done, you can now add a breakpoint to the code you want to debug, (make sure you're in the same code version that you built in debug mode in the previous step, otherwise you'll get the message saying the breakpoint cannot be attached).


So, that's it! You should now be able to troubleshoot and fix your issue on an Azure webApp.
Thanks for your reading!